All 32 Sitcoms, ranked by 109 players
Players rank The Office #1: it wins 73.2% of its matchups (n = 298) and took the title in 21 of 109 brackets. Friends and Modern Family follow. Disagree? Best Sitcoms Ranked is one tap away.
Updated hourly · last refreshed November 15, 2026
Brackets finished109
Head-to-head picks2,851
Entrants ranked32of 32
The Office title share19.3%n = 109
Title odds
Share of 109 finished brackets won
- The Office19.3% (21 of 109)
- Friends9.2% (10 of 109)
- It's Always Sunny in Philadelphia9.2% (10 of 109)
- How I Met Your Mother8.3% (9 of 109)
- Arrested Development6.4% (7 of 109)
- Modern Family5.5% (6 of 109)
Sitcoms: the community tier list
Built from win rates across 2,851 picks. Tiers use the win rate steadied toward 50% for entrants with few matchups (S from 75%, A 60%, B 50%, C 40%, D 25%). Steadying pulls a small sample toward the middle, so a high raw rate can sit a tier lower and a low one a tier higher than the rate shown, which is the raw one. What does S tier mean?
Stier, win rate 75% or more
- Nobody yet
Atier, win rate 60% or more
- The Office73.2%

- Friends66.2%

- Modern Family64.0%

- Brooklyn Nine-Nine61.3%

- How I Met Your Mother61.0%

Btier, win rate 50% or more
- It's Always Sunny in Philadelphia59.1%

- Seinfeld58.8%

- Malcolm in the Middle58.5%

- The Big Bang Theory56.6%

- Parks and Recreation55.8%

- Arrested Development54.9%

- New Girl53.1%

- The Good Place51.4%

Ctier, win rate 40% or more
- Curb Your Enthusiasm48.6%

- Abbott Elementary47.8%

- Community47.3%

- Ted Lasso46.2%

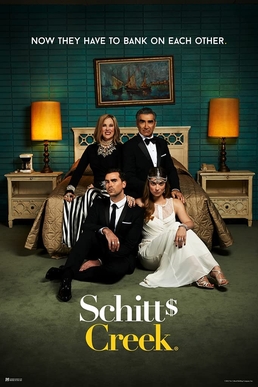
- Schitt's Creek45.8%
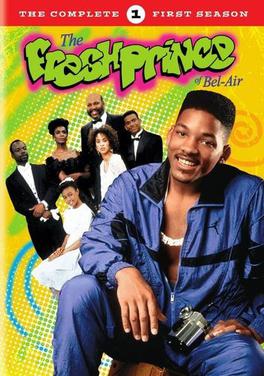
- The Fresh Prince of Bel-Air44.5%
- Two and a Half Men44.4%

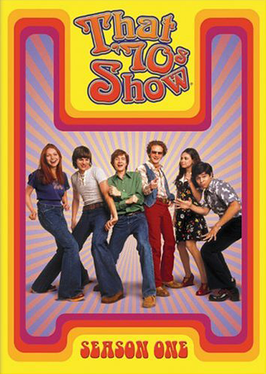
- That '70s Show41.8%
- Scrubs40.8%

- Superstore40.3%

- King of the Hill40.0%

Dtier, win rate 25% or more
- The Bear37.2%

- 30 Rock34.3%

- Cheers32.5%

- Fleabag31.0%

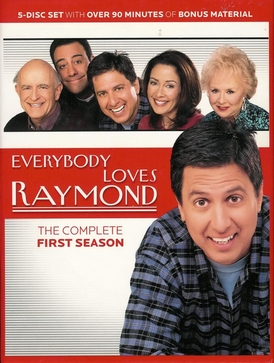
- Everybody Loves Raymond30.7%
- Frasier30.7%

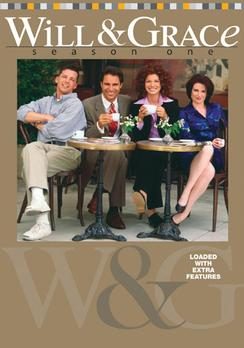
- Will & Grace25.9%
- Veep23.8%

Ftier, win rate 0% or more
- Nobody yet
Standings
Every entrant with its record. Ordered by win rate, steadied for small samples; a rate shows once an entrant has 30 matchups. n is the number of head-to-head matchups behind each rate.
| # | Show | W–L | Win rate | Against .500 | Titles | n |
|---|---|---|---|---|---|---|
| 1 | The Office2005-2013 | 218–80 | 73.2% | 21 | 298 | |
| 2 | Friends1994-2004 | 180–92 | 66.2% | 10 | 272 | |
| 3 | Modern Family2009-2020 | 151–85 | 64.0% | 6 | 236 | |
| 4 | Brooklyn Nine-Nine2013-2021 | 136–86 | 61.3% | 2 | 222 | |
| 5 | How I Met Your Mother2005-2014 | 147–94 | 61.0% | 9 | 241 | |
| 6 | It's Always Sunny in Philadelphia2005-present | 127–88 | 59.1% | 10 | 215 | |
| 7 | Seinfeld1989-1998 | 114–80 | 58.8% | 5 | 194 | |
| 8 | Malcolm in the Middle2000-2006 | 120–85 | 58.5% | 6 | 205 | |
| 9 | The Big Bang Theory2007-2019 | 111–85 | 56.6% | 6 | 196 | |
| 10 | Parks and Recreation2009-2015 | 120–95 | 55.8% | 1 | 215 | |
| 11 | Arrested Development2003-2019 | 106–87 | 54.9% | 7 | 193 | |
| 12 | New Girl2011-2018 | 104–92 | 53.1% | 5 | 196 | |
| 13 | The Good Place2016-2020 | 94–89 | 51.4% | 2 | 183 | |
| 14 | Curb Your Enthusiasm2000-2024 | 85–90 | 48.6% | 1 | 175 | |
| 15 | Abbott Elementary2021-present | 85–93 | 47.8% | 0 | 178 | |
| 16 | Community2009-2015 | 87–97 | 47.3% | 3 | 184 | |
| 17 | 79–92 | 46.2% | 1 | 171 | ||
| 18 | Schitt's Creek2015-2020 | 76–90 | 45.8% | 4 | 166 | |
| 19 | The Fresh Prince of Bel-Air1990-1996 | 73–91 | 44.5% | 1 | 164 | |
| 20 | Two and a Half Men2003-2015 | 72–90 | 44.4% | 1 | 162 | |
| 21 | That '70s Show1998-2006 | 69–96 | 41.8% | 2 | 165 | |
| 22 | Scrubs2001-2010 | 58–84 | 40.8% | 0 | 142 | |
| 23 | Superstore2015-2021 | 58–86 | 40.3% | 1 | 144 | |
| 24 | King of the Hill1997-present | 64–96 | 40.0% | 1 | 160 | |
| 25 | The Bear2022-2026 | 51–86 | 37.2% | 0 | 137 | |
| 26 | 30 Rock2006-2013 | 46–88 | 34.3% | 2 | 134 | |
| 27 | Cheers1982-1993 | 41–85 | 32.5% | 1 | 126 | |
| 28 | 39–87 | 31.0% | 1 | 126 | ||
| 29 | Everybody Loves Raymond1996-2005 | 39–88 | 30.7% | 0 | 127 | |
| 30 | Frasier1993-2004 | 42–95 | 30.7% | 0 | 137 | |
| 31 | Will & Grace1998-2020 | 30–86 | 25.9% | 0 | 116 | |
| 32 | Veep2012-2019 | 29–93 | 23.8% | 0 | 122 |
Closest rivalries
Pairs the crowd can barely split. Estimated from each entrant's overall record until the pair has met 20 times.
- SeinfeldvsMalcolm in the Middle50–50 · estimate from overall records
- Brooklyn Nine-NinevsHow I Met Your Mother50–50 · estimate from overall records
- It's Always Sunny in PhiladelphiavsSeinfeld50–50 · estimate from overall records
Most lopsided
- The OfficevsVeep88–12 · estimate from overall records
- FriendsvsVeep85–15 · estimate from overall records
- Modern FamilyvsVeep83–17 · estimate from overall records
Upsets and oddities
Patterns in 109 finished brackets.
- Biggest upsetThat '70s Show leads It's Always Sunny in Philadelphia 6–4Head-to-head (n = 10), though It's Always Sunny in Philadelphia's record across all its matchups (59.1%) beats That '70s Show's (41.8%). The records alone give That '70s Show 34%.
- UntouchableThe Office wins 73.2%The best record in the field (n = 298 matchups).
- Clutch30 Rock: 2 titlesOnly #26 on win rate, but #16 for championships.
- Always the bridesmaidModern Family: 64.0% win rate#3 on record, but only 6 titles in 109 brackets.
- Still waitingAbbott Elementary: no titles yetWins 47.8% of its matchups (n = 178) and has never been crowned.
Questions people ask
What is #1 in the Sitcoms community ranking?
The Office. It wins 73.2% of its head-to-head matchups (n = 298) and took the title in 21 of 109 finished brackets.
How is the ranking worked out?
Every pick in a finished bracket is a win for one entrant and a loss for the other. Entrants are ordered by win rate, steadied toward 50% by ten imaginary matchups so that a newcomer with a 3–0 record can't top the table. The rate shown is the real one, with n, the number of matchups behind it.
Why win rate and not titles?
Draws are shuffled, so a title can come from an easy path. Win rate counts every matchup an entrant played, which is a fairer read of how people feel about it. Title odds are shown too, as the share of finished brackets each entrant won.
How many people have ranked Sitcoms?
109 finished brackets so far, with 2,851 head-to-head picks between them. Only finished brackets count.
Can I rank all 32 myself?
Yes. Play the bracket at 8, 16, 32 entrants, free and with no sign-up. You get your own ranking and a link to share, and your picks join this page.
How often does this page update?
About every hour, as new brackets are finished.
More brackets
Your turn: is the crowd right?
Pick a winner in every matchup and see where you agree with 109 players, and where you don't.